
Forecast how the market is likely to move after an announcement, plan it, trade it.
Economic announcements happen every day affecting the way prices move. How do you make the most of these opportunities? Zoom in to past data and get the right insight to plan your trade. Be in-the-know and make calculated decisions. Economic Insight is not your average economic calendar. This is a power tool on steroids. Analyze, plan and trade directly from it.
First let’s make sure you know some basic stuff so you can use Economic Insight effectively. Don’t worry about the calculations. These are all done for you on the spot.
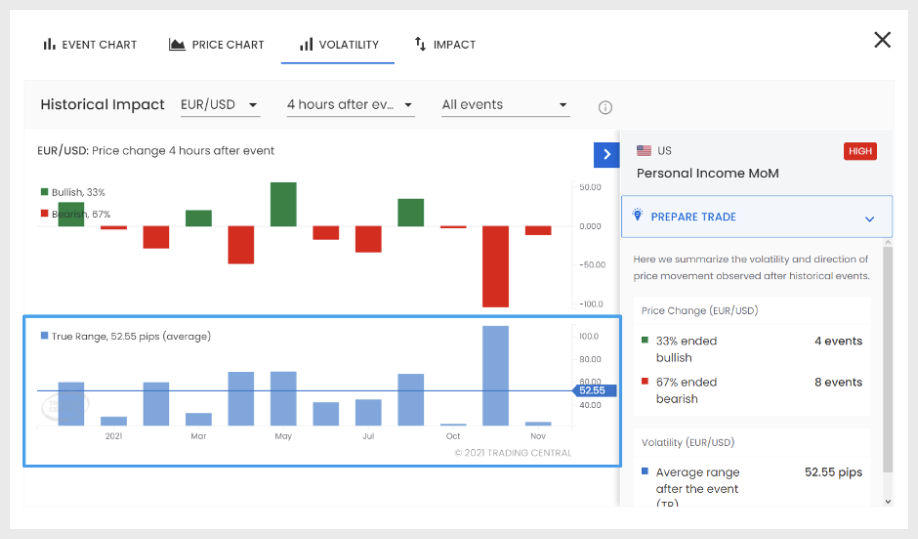
We crunch complex data to simple decision-making level analysis. This gives you a clear understanding of how the market behaved. Economic Insight uses the “True Range” indicator to generate analysis of historical data. It then converts these values to “True Range Pips” to show the trader the scale of historical pips movement for the particular economic event.
The bar chart shows the historic True Range Pips for the chosen currency pair and timeframe.
If you set the timeframe to “4 hours after event” for an event that happened at 12:00, your chart will show the volatility in True Range Pips between 12:00 and 16:00.
This chart shows the price direction for the chosen currency pair and the chosen timeframe after the economic event.
If you choose “1 hour after event” for an event that happened at 12:00, Economic Insight will compare the price of the currency pair at 13:00 against the price at 12:00. Your chart will show on which instances the price rose and on which it fell.
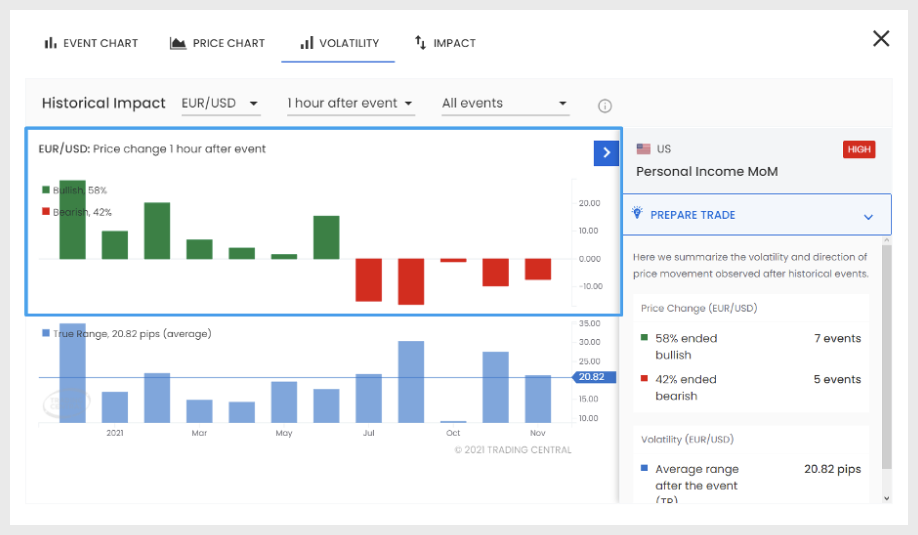
Check out the split between Bullish and Bearish impact and the Average Volatility in True Range Pips from the last 12 occurrences in the summary section.
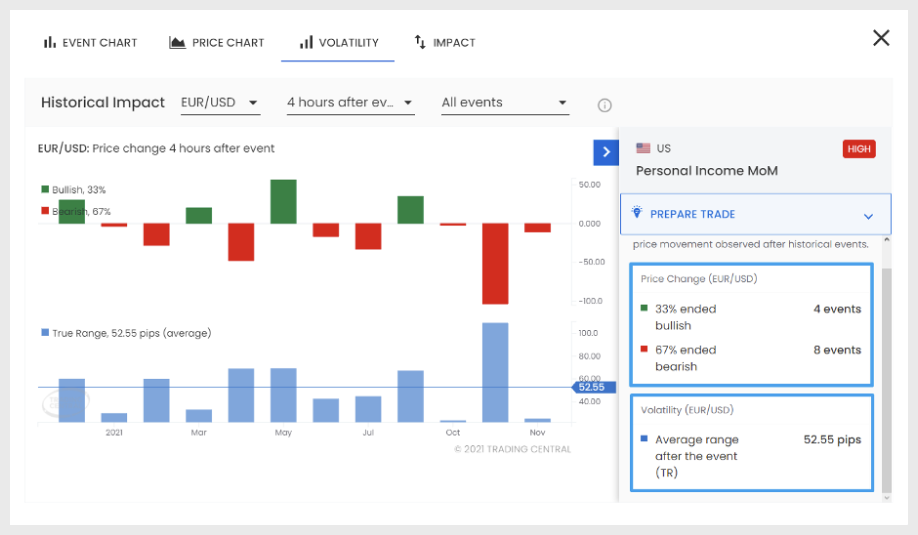
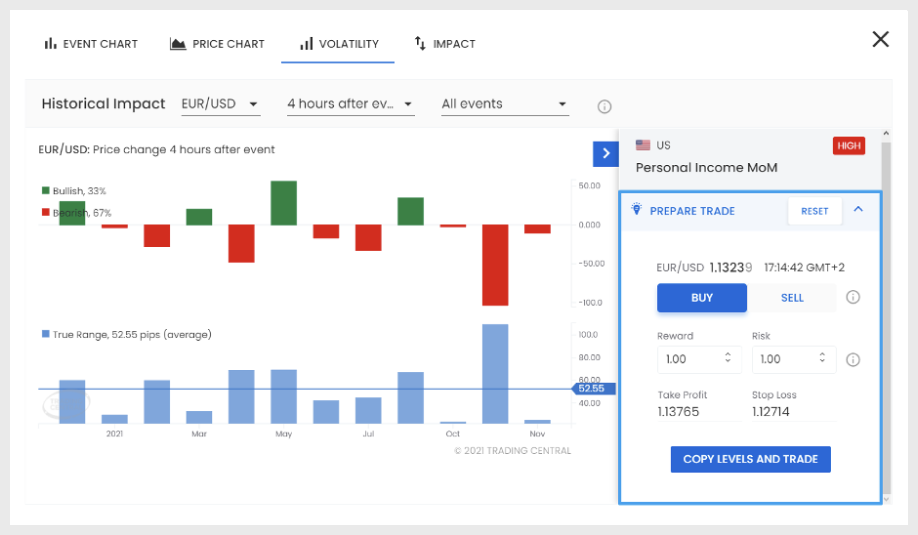
Consider the Actual result vs the Forecast and the past market reactions to the economic event and decide if you need to buy or sell.
Economic Insight reads the going market price and calculates automatically where your Take-Profit and Stop-Loss should be. This is based on the Risk/Reward ratio you choose and the Average True Range Pips for the chosen Timeframe.
Tap the “Copy Levels and Trade” button and your trade setup will copied onto a new order ready for execution.
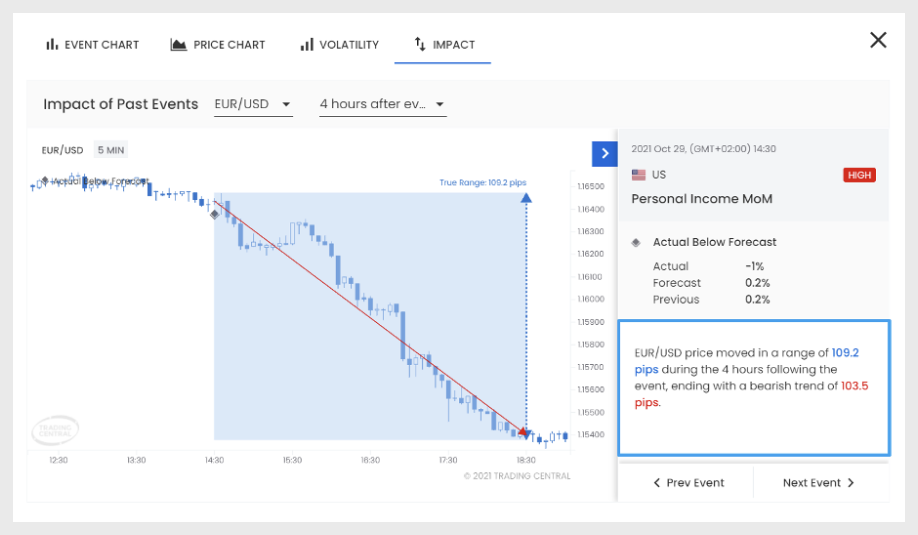
Flick through past occurrences of the economic event and drill down on how the market behaved for your chosen currency pair and timeframe. Compare the actual Price Change against the True Range Pips movement for 4 different timeframes to draw clear conclusions. Visualize the impact the of the economic event on a candlestick chart.
As a premium, one stop shop for investment decision support, we firmly believe the best way to support your brokerage business is by facilitating the long-lasting success of your investing customers. We help them find and validate new opportunities, time their trades, learn about financial markets, and manage their risk. Our online broker solutions harness an award-winning fusion of automated AI analytics, beautiful user interfaces and registered investment adviser expertise.